Feature Showcase - Debug an XSLT Program
(Komodo IDE only)
When debugging XSLT programs in Komodo, view the execution location of the XSLT file and the XML input file at the same time.
Note: The key bindings used in this showcase are for Windows/Linux users. To find the equivalent key bindings for macOS, select Help > Key Bindings.
Select Project > Sample Project.
Double-click the
xslt_sample.xslfile in the Places pane.Select Debug > Step In.
In the Debugging Options dialog box, enter
birds.xml(also in the Komodo Sample Project) as the input file. Click OK.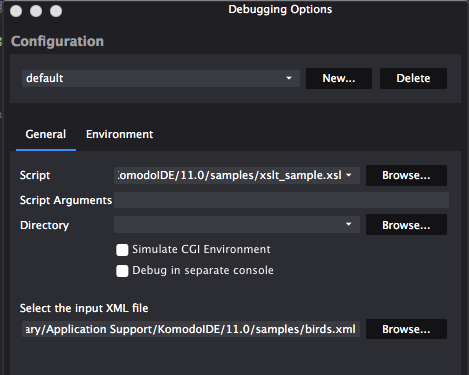
Komodo displays split editor pane with yellow arrows showing point of execution in both the XML and XSLT files. Step through the code using the Step In button (
F11), or set breakpoints and use the Go/Continue button (F5).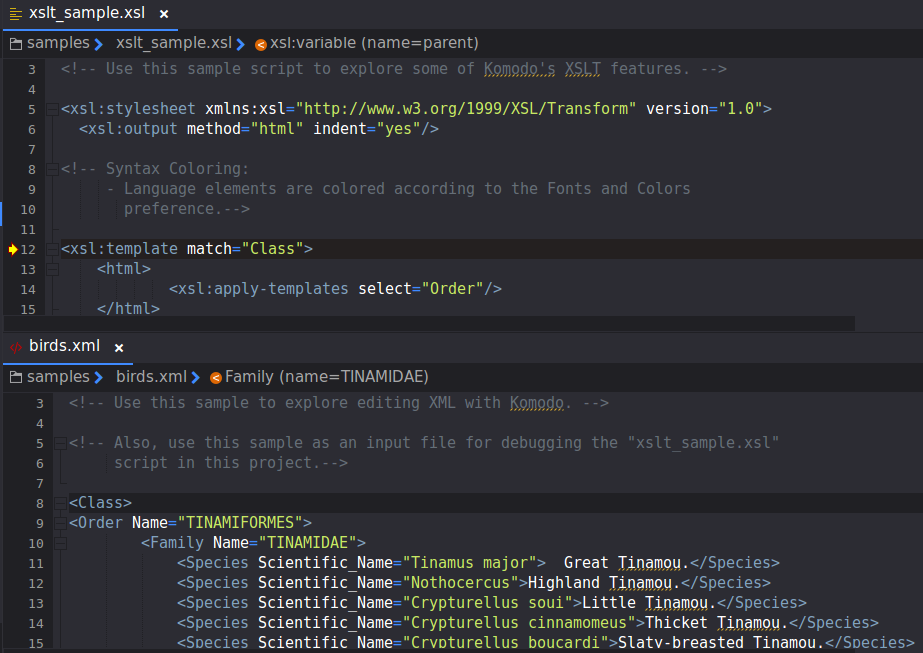
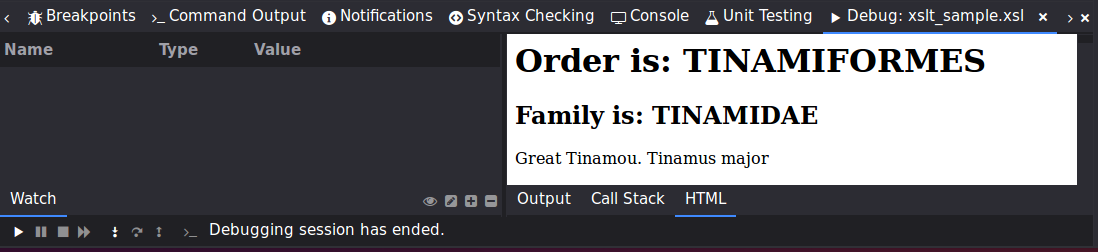
When debugging is complete the results of the transformation appear in the Debug tab in the Bottom pane. The raw output is displayed in the Output sub-tab, and the rendered output is displayed in the HTML sub-tab. Output tab. Select the HTML sub-tab to preview the rendered results.