Code Profiling
(Komodo IDE only)
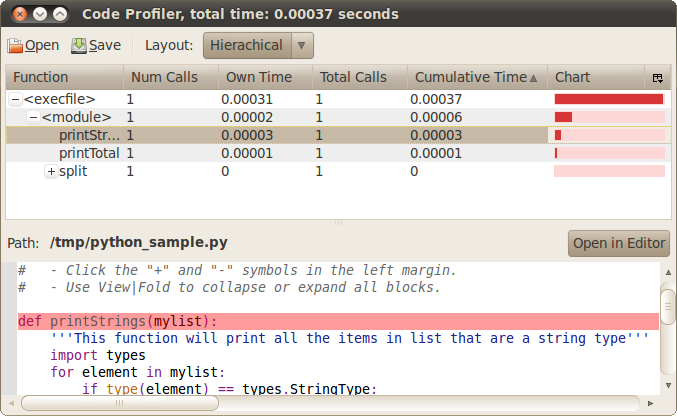
The Komodo code profiler analyzes programs on a function by function basis, tracking which function calls are made, which functions call into other functions, and how long these calls take to complete.
Komodo provides code profiling support for Python and PHP (version 5.2 or higher), though it can also read these profiling formats:
- Callgrind/Cachegrind/KCachegrind - such as Xdebug’s PHP code profiler produces
- pstats - produced by the Python cProfile and Profile standard library modules
To load a previously executed profiling sessions from a file, launch the Code Profiler interface with Tools > Code Profiler.
Starting a New Code Profiling Session
As with local and remote debugging, Komodo can perform code profiling on your local file system (Local Code Profiling) or run profiling on a remote system and report the results back over the network for Komodo to display (Remote Code Profiling).
Local Code Profiling
To create a new local session:
- Click Debug > Start Code Profiling. By default, the Profiling Options dialog box is displayed with the current file in the Script filed. This dialog has has the same fields as Debugging Options
- Optionally, add any interpreter or script arguments the program requires, any necessary environment variables, and set the execution directory (if it should be different than the current directory of the file).
- Click OK. The profiler tracks the progress of the running program as it executes and gathers data. When it finishes, Komodo will display the results in the Code Profiler
Remote Code Profiling
Remote profiling executes code on a remote machine using the remote debugging libraries and reports back to Komodo through the debugger port. Komodo displays the remote profiling data in the same interface as local profiling.
Python
To profile Python applications remotely, launch the “pydbgp” application with the –profiling command line option. See Komodo’s Python Remote Debugging documentation for further details.
PHP
To profile PHP applications you will need to use PHP 5.2 or higher and the xdebug library included with Komodo IDE. See Komodo’s PHP Remote Debugging documentation for basic configuration details, then change the Xdebug remote_mode setting to “profile“:
xdebug.remote_mode=profile
Remote code that is run with this configuration will connect back to Komodo and send the code profiling data at the end of the application’s execution.